
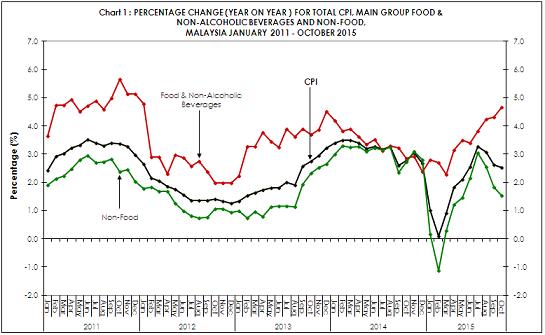
Overall, the index for Food & Non-Alcoholic Beverages (weight: 30.3) rose 4.7 per cent on a year-on-year basis in October 2015. Meanwhile, the index for Non-Food (weight: 69.7) recorded an increase of 1.5 per cent (Chart 1 and Table 1) .
On a monthly basis, CPI for October 2015 increased by 0.4 per cent. CPI for the first ten months in 2015 registered an increase by 2.0 per cent as compared to the same period last year.
Monthly Changes for CPI
When compared with the previous month, CPI for October 2015 increased by 0.4 per cent. Of the twelve major groups, four recorded an increase, three registered a decline while five remained unchanged. Among the major groups which recorded increases in October 2015 were Transport (+3.0 per cent); Food & Non-Alcoholic Beverages (+0.2 per cent); Health (+0.2 per cent); and Restaurants & Hotels (+0.2 per cent) .
Based on a seasonally adjusted term, the CPI for October 2015 increased by 0.4 per cent as compared to September 2015 (Table 1).
|
Group
|
Wt.
|
Index
|
Year-on-Year Percentage Change |
Month-on-Month Percentage Change
|
Seasonally Adjusted Index | ||||
|
Oct 2015
|
Sep 2015/ Sep 2014
|
Oct 2015/ Oct 2014
|
Jan - Oct 2015/2014
|
Sep 2015/
Aug 2015 |
Oct 2015/
Sep 2015 |
Oct 2015 | % Change Oct 2015/ Sep 2015 | ||
| TOTAL |
100.0
|
114.1 | 2.6 | 2.5 | 2.0 | -0.3 | 0.4 | 114.1 | 0.4 |
| Food & Non-Alcoholic Beverages |
30.3
|
121.0 | 4.3 | 4.7 | 3.5 | 0.2 | 0.2 | 121.2 | 0.2 |
| Alcoholic Beverages & Tobacco |
2.2
|
138.1 | 9.8 | 13.3 | 11.7 | 0.0 | 0.0 | 138.1 | 0.0 |
| Clothing & Footwear |
3.4
|
98.9 | 0.7 | 0.7 | 0.4 | 0.2 | -0.1 | 98.9 | -0.1 |
| Housing, Water, Electricity, Gas & Other Fuels |
22.6
|
112.2 | 2.7 | 2.7 | 2.5 | 0.0 | 0.0 | 112.4 | 0.2 |
| Furnishings, Household Equip. & Routine Household Maintenance |
4.1
|
110.6 | 3.7 | 3.8 | 2.4 | 0.0 | -0.1 | 110.6 | -0.1 |
| Health |
1.3
|
116.1 | 4.6 | 4.7 | 4.4 | 0.3 | 0.2 | 116.1 | 0.2 |
| Transport |
14.9
|
110.0 | -3.8 | -5.7 | -4.2 | -2.8 | 3.0 | 110.0 | 3.0 |
| Communication |
5.7
|
100.6 | 3.2 | 3.3 | 1.7 | 0.1 | 0.0 | 100.6 | 0.0 |
| Recreation Services & Culture |
4.6
|
107.4 | 2.3 | 2.4 | 1.6 | 0.2 | 0.0 | 107.4 | 0.0 |
| Education |
1.4
|
112.8 | 2.5 | 2.5 | 2.4 | 0.0 | 0.0 | 113.3 | 0.2 |
| Restaurants & Hotels |
3.2
|
123.2 | 4.6 | 4.7 | 4.1 | 0.2 | 0.2 | 123.2 | 0.2 |
| Miscellaneous Goods & Services |
6.3
|
111.4 | 5.6 | 5.8 | 3.9 | 1.0 | -0.1 | 111.4 | -0.1 |
| Non-Food |
69.7
|
111.1 | 1.8 | 1.5 | 1.3 | -0.5 | 0.6 | 114.1 | 0.6 |
Meanwhile, the index of some food items decreased in October 2015 compared with the previous month. Among these food items were Cucumber (-13.3 per cent); Watermelon (-8.4 per cent); Red Chillies (-4.3 per cent); Chicken (-3.7 per cent); Longtail Tuna (Fish) (-1.9 per cent); Hardtail Scad (Fish) (-1.3 per cent); Indian Mackerel (Fish) (-1.0 per cent); and Spanish Mackerel (Fish) (-1.0 per cent).
|
Sub-Groups
|
Wt.
|
Index | Year-on-Year Percentage Change | Month-on-Month Percentage Change | |||
|
Oct 2015
|
Sep 2015/ Sep 2014
|
Oct 2015/ Oct 2014
|
Jan - Oct 2015/2014
|
Sep 2015/ Aug 2015
|
Oct 2015/ Sep 2015
|
||
| Food & Non-Alcoholic Beverages | 30.3 | 121.0 | 4.3 | 4.7 | 3.5 | 0.2 | 0.2 |
| Food | 28.9 | 121.4 | 4.4 | 4.7 | 3.6 | 0.3 | 0.1 |
| Food At Home | 18.9 | 120.8 | 4.4 | 4.9 | 3.3 | 0.3 | 0.0 |
| Rice, Bread & Other Cereals | 4.4 | 107.5 | 1.7 | 1.8 | 1.6 | -0.2 | 0.0 |
| Meat | 2.9 | 118.4 | 0.9 | 2.4 | 1.8 | 0.2 | -1.7 |
|
Fish & Seafood
|
4.5 | 132.5 | 6.2 | 6.1 | 3.9 | 0.6 | 0.0 |
| Milk & Eggs | 1.8 | 124.2 | 4.3 | 4.1 | 5.2 | 1.2 | 0.4 |
| Oils & Fats | 0.6 | 101.9 | 0.9 | 0.8 | 0.5 | 0.1 | 0.0 |
| Fruits | 1.2 | 122.7 | 5.9 | 5.9 | 3.7 | 0.5 | -0.2 |
| Vegetables | 2.1 | 124.6 | 10.5 | 12.7 | 6.7 | -0.2 | 2.0 |
| Sugar, Jam, Honey, Chocolate & Confectionary | 0.6 | 132.0 | 2.0 | 2.0 | 1.7 | 0.0 | 0.0 |
| Foof Products n.e.c | 0.8 | 121.1 | 5.4 | 5.7 | 4.3 | 0.3 | 0.5 |
| Food Away From Home | 10.0 | 122.5 | 4.4 | 4.3 | 3.8 | 0.2 | 0.2 |
| Coffee, Tea, Cocoa & Non-Alcoholic Beverages | 1.4 | 111.5 | 3.2 | 3.1 | 2.3 | 0.3 | -0.1 |
CPI changes for the period January – October 2015 / 2014
The increase of 2.0 per cent in the CPI for the first ten months in 2015 was led by increases among the main groups with high weights: Food & Non-Alcoholic Beverages (+3.5 per cent) and Housing, Water, Electricity, Gas & Other Fuels (+2.5 per cent). Other increases were Alcoholic Beverages & Tobacco (+11.7 per cent); Health (+4.4 per cent); Restaurants & Hotels (+4.1 per cent); and Miscellaneous Goods & Services (+3.9 per cent). On the other hand, a decrease was recorded in the index of Transport by 4.2 per cent.
Based on the above changes and the weights assigned to the main groups, the relative contribution to the overall increase of 2.0 per cent in the CPI is shown in Table 3.
Table 3 : CONTRIBUTION TO THE CHANGES IN THE OVERALL CONSUMER PRICE INDEX BY MAIN GROUPS, MALAYSIA (2010=100)
|
Group
|
Wt.
|
2014 / 2013
|
October 2015 / 2014 |
January - October 2015 / 2014
|
|||
| % Change | % Contribution | % Change | % Contribution | % Change | % Contribution | ||
| TOTAL | 100.0 | 3.2 | 100.0 | 2.5 | 100.0 | 2.0 | 100.0 |
| Food & Non-Alcoholic Beverages | 30.3 | 3.3 | 34.0 | 4.7 | 58.2 | 3.5 | 54.9 |
|
Alcoholic Beverages & Tobacco
|
2.2 | 11.6 | 8.3 | 13.3 | 12.7 | 11.7 | 14.0 |
| Clothing & Footwear | 3.4 | -0.2 | -0.3 | 0.7 | 0.8 | 0.4 | 0.5 |
| Housing, Water, Electricity, Gas & Other Fuels | 22.6 | 3.4 | 24.1 | 2.7 | 24.0 | 2.5 | 27.3 |
| Furnishings, Household Equipment & Routine Household Maintenance | 4.1 | 1.0 | 1.3 | 3.8 | 5.9 | 2.4 | 4.7 |
| Health | 1.3 | 2.9 | 1.2 | 4.7 | 2.5 | 4.4 | 2.9 |
| Transport | 14.9 | 4.9 | 23.1 | -5.7 | -36.0 | -4.2 | -31.9 |
| Communication | 5.7 | -0.7 | -1.3 | 3.3 | 6.4 | 1.7 | 4.2 |
| Recreation Services & Culture | 4.6 | 1.5 | 2.2 | 2.4 | 4.1 | 1.6 | 3.3 |
|
Education
|
1.4 | 2.4 | 1.1 | 2.5 | 1.4 | 2.4 | 1.7 |
| Restaurant & Hotel | 3.2 | 4.7 | 5.0 | 4.7 | 6.4 | 4.1 | 6.9 |
| Miscellaneous Goods & Services | 6.3 | 0.7 | 1.3 | 5.8 | 13.7 | 3.9 | 11.5 |
The increase of 3.5 per cent in the index for Food & Non-Alcoholic Beverages was the result of increases for Food At Home (+3.3 per cent); Food Away From Home (+3.8 per cent) and Coffee, Tea, Cocoa & Non-Alcoholic Beverages (+2.3 per cent). Among the subgroups of Food At Home which showed significant increases during this period as shown in Table 2 were Vegetables (+6.7 per cent); Milk & Eggs (+5.2 per cent); Fish & Seafood (+3.9 per cent); and Fruits (+3.7 per cent).
Released By:
THE OFFICE OF CHIEF STATISTICIAN MALAYSIA
DEPARTMENT OF STATISTICS, MALAYSIA
#myHariBulan# #myBulan# #myTahun#
Contact person:
Norrita binti Amran
Public Relation Officer
Corporate and User Services Division
Department of Statistics, Malaysia
Tel : +603-8885 7942
Fax : +603-8888 9248
Email : norrita.amran@stats.gov.my
An Error occurred while handling another error:
yii\web\HeadersAlreadySentException: Headers already sent in /var/www/html/dosm/frontend/controllers/SiteController.php on line 191. in /var/www/html/dosm/vendor/yiisoft/yii2/web/Response.php:368
Stack trace:
#0 /var/www/html/dosm/vendor/yiisoft/yii2/web/Response.php(341): yii\web\Response->sendHeaders()
#1 /var/www/html/dosm/vendor/yiisoft/yii2/web/ErrorHandler.php(136): yii\web\Response->send()
#2 /var/www/html/dosm/vendor/yiisoft/yii2/base/ErrorHandler.php(152): yii\web\ErrorHandler->renderException()
#3 [internal function]: yii\base\ErrorHandler->handleException()
#4 {main}
Previous exception:
yii\web\HeadersAlreadySentException: Headers already sent in /var/www/html/dosm/frontend/controllers/SiteController.php on line 191. in /var/www/html/dosm/vendor/yiisoft/yii2/web/Response.php:368
Stack trace:
#0 /var/www/html/dosm/vendor/yiisoft/yii2/web/Response.php(341): yii\web\Response->sendHeaders()
#1 /var/www/html/dosm/vendor/yiisoft/yii2/base/Application.php(390): yii\web\Response->send()
#2 /var/www/html/dosm/www/index.php(24): yii\base\Application->run()
#3 {main}